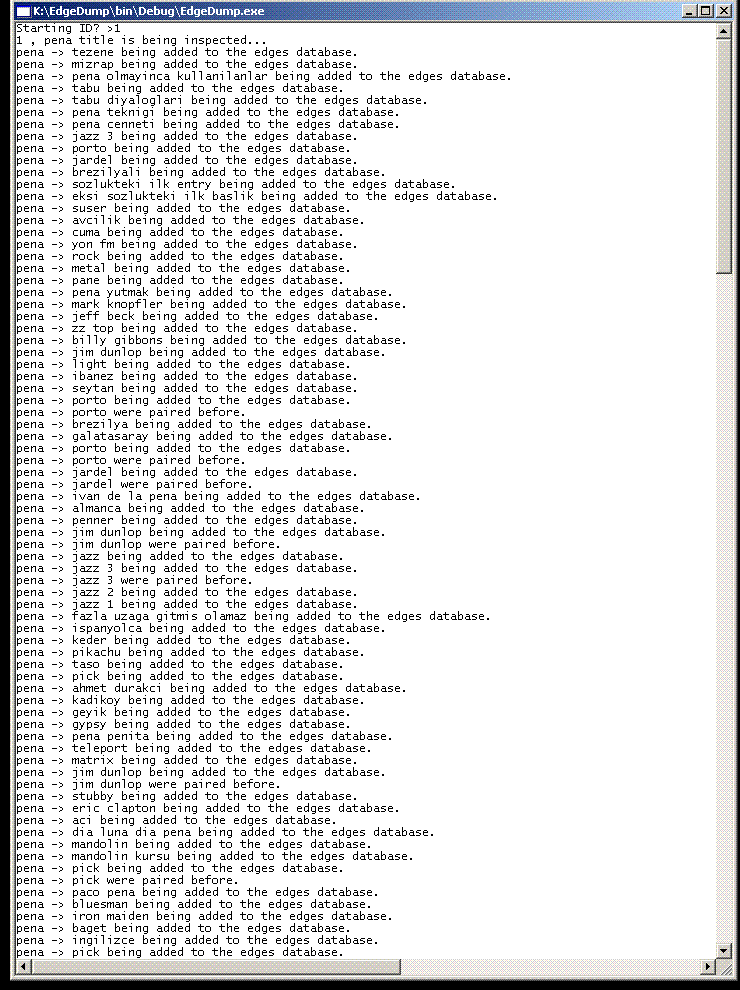
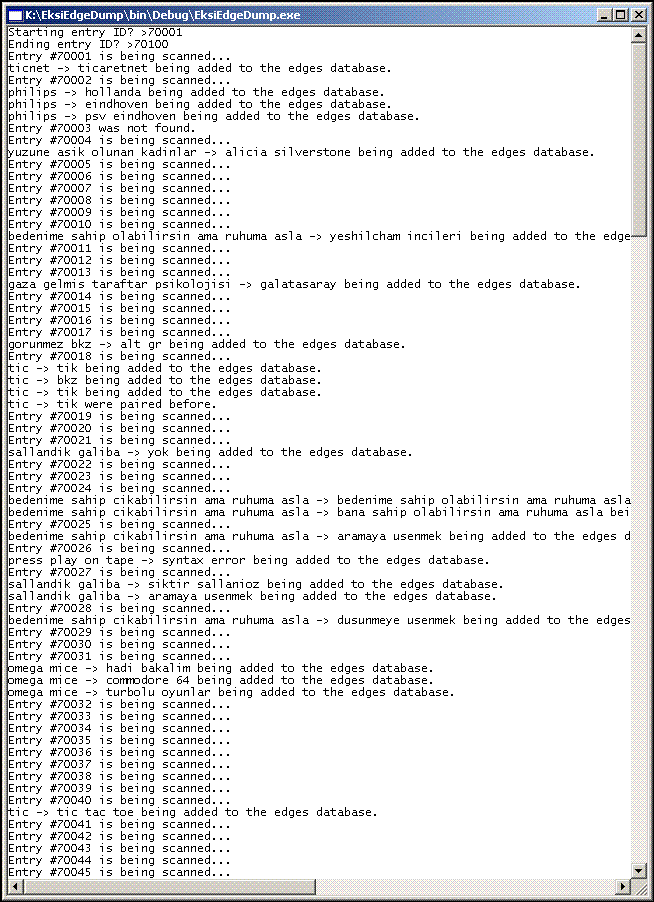
The Problem: Designing a program that generates a digraph from the edge data generated by ek$iEdgeDump.
Design: This part of the project was the most troublesome part, involving a cascade of decisions. As the project supervisor, Prof. Attila Gürsoy advised making use of graph layout libraries, such as JUNG(*) (Java Universal Network/Graph Framework), yWorks(**) or GraphViz(***). During the research phase, however, it was observed that neither of these options was worth the effort; JUNG could not be used within C#, yWorks was a commercial package with costs beyond my budget for the foreseeable future, GraphViz seemed too hard to implement. Later on, I found a Windows DLL port of GraphViz(****) and modified ek$iVista to generate a text file in DOT format (file format accepted by GraphViz). However, the lexer inside GraphViz could not parse the text file generated by ek$iVista with no apparent reason, so the use of the GraphViz was out of question. It was becoming obvious that the layout algorithm and generation of the diagram had to be handmade.
From a very large array of layout algorithms, like the Kamada Kawai algorithm, a random vertex-placement algorithm and many tree layout algorithms, the circle layout was chosen, because in this layout, the vertices were pushed near the borders of the diagram and the center part was left vacant for the edges to be placed. Also, the coordinates of vertices and edges could be calculated by simple trigonometry. First of all, a minimum distance between two vertices is defined; let us name it md. If there are v vertices laid out evenly on the perimeter of a circle, the perimeter is expected to be roughly (md x v) units. The radius of the circle, hence, is (md x v)/2π. The position of the nth vertex on the diagram, given the center of the diagram as the Cartesian pair (cx, cy) is the Cartesian pair (cx + cos(360n/v)((md x v)/2π), cy + sin(360n/v)((md x v)/2π)). As we know the coordinates of the vertices and have a list of edges, drawing the directed edges should be trivial.
Everything is expected to fit in without any problems, but expectations are not always met. For enabling interactive vertices that respond to clicks, a control named VistaVertex was created which contained four buttons envisaged to fire some events and methods. However, as the number of vertices rose, the application became more than cumbersome. Also, an unadvertised “feature” of Windows surfaced; one cannot create more than 10,000 controls per application, because Windows cannot generate “handles” for them. Because of this limitation, the use of controls was impossible; the diagram had to be painted on the form and it could not be interactive for the time being. During this phase, I had mounting difficulties when the form had to be refreshed, because whole diagram had to be painted from scratch and I could not figure out a method to avoid this. Finally, I decided to generate a viewable image by using the graphics libraries provided in C#, and discovered another hidden limitation; drawing images larger than 32,678 x 32,768 was impossible. Such a limitation was also imposed upon the size of forms; although the property that keeps the height and width of the form is of type Int32 (232 ≈ 4 x 10⁹), the maximum value it accepted was 215. With the current number of vertices, however, this poses no big problem.
The program first reads the source titles into a Hashtable and gets the total number of vertices. After this, a SortedList (a Hashtable sorted according to the keys of the items) object is populated by Point objects that store the calculated coordinates of the vertices with the title names assigned as their keys. Then, EksiEdgeData table is read from beginning to end; if the source title corresponds to a key in the hashtable, the directed edge is drawn. After all the edges are drawn, the vertices are drawn onto the image, and finally, the image is saved at a fixed location, the root of the C:\ drive.
The graph drawn by ek$iVista, although substantially rich in data, is not very adept at displaying the connections between Ekşi Sözlük titles as much of the meaning is lost in the clutter. As it was stated before, the “final” graph produced contained the details of only a small portion of Ekşi Sözlük data and finally, the graph, although envisaged to be interactive at first, was far from interactivity. To rectify these shortcomings, a new version for ek$iVista was
The Problem: Providing means of visualizing and analyzing Ekşi Sözlük data gathered by ek$iDump – especially the links between titles and the users contributing to titles. Also, correcting the flaws of the first version; trying to draw the whole graph which makes it unintelligible, having to rely on a separate table (EksiEdgeData) generated beforehand to come up with the graph while the data for it could be generated on-the-fly, and providing no outlets for interactivity.
Design and Implementation: The first design decisions were about what to include in this application and what to leave out. To see what has been done clearly, let us use a weekly update mail as our checklist:
“I spotted a graph visualization package named Netron (http://netron.sourceforge.net/) and will be using this package for the title connections graph.”
The graph visualization package that has been used, as it is stated above, is an open-source package named Netron, an initiative started by François Vanderseypen to provide a functional library of tools written in C# for producing diagrams in .NET platform. Netron contains many object types necessary to draw a connectivity graph and also some layout algorithms, such as the tree layout, random layout and the spring embedder. As the library is open source, it is freely extensible. Another interesting feature of this library is its support for drawing cellular automata outputs. The title connectivity graph generated by ek$iVista makes use of this library and the layout algorithm chosen is the spring embedder algorithm.
- “The queries that I am going to use in ek$iVista are:
- The one that will be used to draw the connectivity graph (with the option of displaying titles 1, 2, 3, 4 and 5 clicks ahead)
- Simple queries that will list the users who contributed to the title and the entries under the title (with the option of opening it from the database with or directly from Ekşi Sözlük)
- Queries that will help to draw timelines for activity, for titles and users
- A query for finding the "intersection set" of the titles written to by two distinct users”
All the queries mentioned above are included with one addition and one exception; the option of opening the entries under a title from the database was omitted as Ekşi Sözlük contained the most up-to-date information on any title imaginable, and as listing more than 700,000 titles in a combo box used to select the title to work on is a fairly daunting task, a query for listing the 10 titles most relevant to the given input was added. These queries were implemented as stored procedures as the data traffic is minimized between the application and the RDBMS and time is used more efficiently as stored procedures precompiled and prepared; they do not have to be compiled over and over like other SQL statements. The number of stored procedures used is five, and they are:
top10matching: Returns the first 10 matches to the title value input.
CREATE PROCEDURE top10matching @whattitle nvarchar(50) AS SELECT TOP 10 title FROM Titles WHERE title LIKE @whattitle
entryProc: Returns the full list of entries entered under a title.
CREATE PROCEDURE entryProc @whattitle nvarchar(50) AS SELECT * FROM Entries WHERE title = @whattitle
suserIntitle: Returns the full list of susers (without repetition) under a title.
PROCEDURE suserInTitle @whattitle nvarchar(50) AS SELECT dbo.Susers.suser, dbo.Susers.suserID FROM dbo.Susers INNER JOIN dbo.Entries ON dbo.Susers.suserID = dbo.Entries.suserID WHERE (dbo.Entries.title = @whattitle) GROUP BY dbo.Susers.suser, dbo.Susers.suserID
entriesOfSuser: Returns the full list of entries contributed by a suser.
ALTER PROCEDURE entriesOfSuser @whatsuser int AS SELECT * FROM Entries WHERE suserID = @whatsuser
togetherProc: Returns the titles (without repetition) written to by both of the two given susers.
PROCEDURE togetherProc @id1 int, @id2 int AS SELECT title FROM dbo.Entries WHERE (suserID = @id1) GROUP BY title HAVING (title IN (SELECT title FROM dbo.Entries WHERE suserID = @id2))
Although the queries used are fairly simple (the last one is a simple nested query) any timewise gain obtainable had to be obtained, because the system the database runs on (an AMD Athlon 2000+ with 512 MB main memory) is not very powerful as to meet Microsoft SQL Server’s needs.
Other design decisions will be explained in detail in the Walkthrough section, where a normal run of ek$iVista is exhibited.
Walkthrough:
A splash screen like this welcomes the users of ek$iVista.

Fig. 6: Splash screen of ek$iVista
If not desired, it can be eliminated by passing /nosplash argument before running the application. The splash screen was seen as necessary because the user has to be sure that the program is functioning normally as the application strives to scan all (exact number is 781, 367) of the titles in the database and add them to a Hashtable which will be used to check whether the destination titles exist or not. After the scanning of titles is complete, the main form of the application is displayed:

Fig. 7: ek$iVista - overview
As one can see, the interface is fairly simple with TabView components used as sub-forms. An MDI (Multiple Document Interface) form could have been used instead, but MDI forms are not very easy for the end user to deal with and can get scattered around, providing a messy outlook. The tabs contain controls that help display the outcomes produced by the program; “başlık bağlantı grafiği” (title connectivity graph) displays the connectivity graph of a title by making use of the Netron graph control, “browser” displays the contents of titles in Ekşi Sözlük with the help of an Internet Explorer control, “etkinlik grafiği” (activity graph) displays the activity recorded under a title or of a suser in the form of a 3D bar chart with the aid of a Microsoft Chart control, and “yazarlar” (writers) and “ortak başlıklar” (common titles) display the writers (susers) under a title and the common titles of two susers, respectively. These two tabs make use of the ListView control.
At the main entry point, we begin by entering some text in the text box under the label “aradığınız başlık” (the title you are looking for). As one types further, the list below the text box is updated by using the top10matching query to list the 10 titles that are the most relevant to the text entered. This feature helps users to narrow down their searches and find titles when they are not sure of the title they want to inspect. An example is given below.


Fig. 8: Title search feature
We advance by selecting a title from the list, select a value for the hop distance (between 1 and 5, inclusive) from the number selector and click “bağlantı grafiğini çiz” (draw connectivity diagram) to see the connectivity graph with the selected title as the center and the titles at the clicking distance selected from the number selector. If one clicks the button without selecting a title from the list, an error message is displayed.

Fig. 9: Error message - "A title should be chosen from the list."
This connectivity graph is drawn by a BFS (breadth-first search) – like algorithm which takes a starting node (title) and scans through the entries under a title, adding the links inside the entries to a list and drawing the connections between them. If the final hop value is not reached, the titles inside the list formed are scanned and the method for drawing the graph is called for every value in the list.
The graph drawn when the selected title is “inanç lisesi” (the high school that I was graduated from – now known as TEV İnanç Türkeş Özel Lisesi(*****)) and the hop distance as 1 is shown below, with the context menu shown when a title is clicked.

Fig. 10: Title connectivity graph with its context menu
We advance by selecting a title from the list, select a value for the hop distance (between 1 and 5, inclusive) from the number selector and click “bağlantı grafiğini çiz” (draw connectivity diagram) to see the connectivity graph with the selected title as the center and the titles at the clicking distance selected from the number selector. If one clicks the button without selecting a title from the list, an error message is displayed.

Fig. 9: Error message - "A title should be chosen from the list."
This connectivity graph is drawn by a BFS (breadth-first search) – like algorithm which takes a starting node (title) and scans through the entries under a title, adding the links inside the entries to a list and drawing the connections between them. If the final hop value is not reached, the titles inside the list formed are scanned and the method for drawing the graph is called for every value in the list.
The graph drawn when the selected title is “inanç lisesi” (the high school that I was graduated from – now known as TEV İnanç Türkeş Özel Lisesi(*****)) and the hop distance as 1 is shown below, with the context menu shown when a title is clicked.

Fig. 10: Title connectivity graph with its context menu
The context menu options are:
Let us see who has written under the title “mit” by clicking the appropriate menu item. The result, produced by the susersInTitle query, is shown in Fig. 11:

Fig. 11: The list of users who have written under the title "mit"
- “benzer başlık bul” (find similar titles) posts the title name to the text box labeled “aradığınız başlık”,
- “yazarları göster” (show writers) displays the list of susers who contributed to the title in the “yazarlar” tab,
- “etkinlik grafiği” (activity graph) shows the activity graph of the title in the “etkinlik grafiği” tab,
- “ek$i’de aç” (open in ek$i), as its name suggests, opens the title in Ekşi Sözlük, displayed in the “browser” tab.
Let us see who has written under the title “mit” by clicking the appropriate menu item. The result, produced by the susersInTitle query, is shown in Fig. 11:
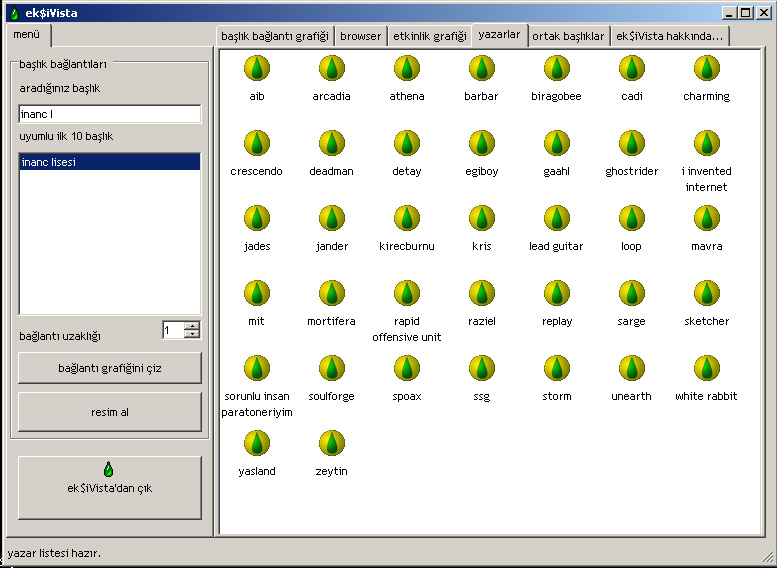
Fig. 11: The list of users who have written under the title "mit"
The activity graph of the title “mit” is obtained by clicking “etkinlik grafiği” in the context menu, which is a bar chart displaying the monthly entry counts of a title or a suser. Three types of activity graphs exist; a general view which displays months, years and number of entries on the axes, the month-based view which shows the counts of entries entered in the 12 months of the year and the year-based view which shows the entry counts corresponding to the years starting from 1999, the year Ekşi Sözlük was established. All three graphs are shown below, in Figs. 12:


Figs. 12: General, monthly and yearly activity graphs for the title "mit"


Figs. 12: General, monthly and yearly activity graphs for the title "mit"
Activity graphs are obtained by calling queries that return entry data. In this entry data, the date the entry was entered is stored as a string value, since, in Ekşi Sözlük, both the date of entry and – if the title is edited later on – the date of the latest edit is stored. As it was not desirable by the designer to work on tables that contain null values (the edit date for entries that are not edited), this scheme of storing date values was adopted; strings can be programmatically parsed down to integer values.
A two-dimensional integer array for storing entry frequencies is created and for every entry data acquired, the date string is obtained, the month and year value is picked and the frequency value corresponding to the month and year value is incremented by one. After all the entry values are consumed, the array is fed to the graph control as data, and thus the activity graph is drawn.
Going back to Fig. 11, we can experience more of the functionality of ek$iVista. When we right-click any portion of the susers list, a context menu appears as shown in Fig. 13. This context menu provides two choices for the user; “ortak başlıkları listele” (list common titles), when two suser names are selected, lists their common titles in “ortak başlıklar” (common titles) tab, and “etkinlik grafiği” (activity graph) which displays the activity graph pertaining to the selected suser. If the selection criteria (selecting 2 susers for “ortak başlıkları listele” or selecting 1 suser for “etkinlik grafiği”) are not met, error messages are displayed. Let us see what happens when we choose two arbitrary susers from the list and request to see their common titles. The common titles list for the susers “yasland” and “zeytin” are shown in the figure below:
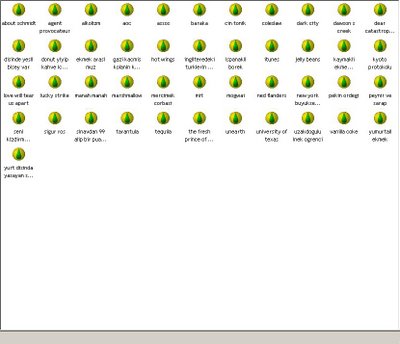
Fig. 13: Common titles list for the users "yasland" and "zeytin"
The items in this tab, “ortak başlıklar”, have the same functionality as any title node in the connectivity graph and have the same context menu. Thus, the details can be inferred from the lines above which mention this context list.
A two-dimensional integer array for storing entry frequencies is created and for every entry data acquired, the date string is obtained, the month and year value is picked and the frequency value corresponding to the month and year value is incremented by one. After all the entry values are consumed, the array is fed to the graph control as data, and thus the activity graph is drawn.
Going back to Fig. 11, we can experience more of the functionality of ek$iVista. When we right-click any portion of the susers list, a context menu appears as shown in Fig. 13. This context menu provides two choices for the user; “ortak başlıkları listele” (list common titles), when two suser names are selected, lists their common titles in “ortak başlıklar” (common titles) tab, and “etkinlik grafiği” (activity graph) which displays the activity graph pertaining to the selected suser. If the selection criteria (selecting 2 susers for “ortak başlıkları listele” or selecting 1 suser for “etkinlik grafiği”) are not met, error messages are displayed. Let us see what happens when we choose two arbitrary susers from the list and request to see their common titles. The common titles list for the susers “yasland” and “zeytin” are shown in the figure below:
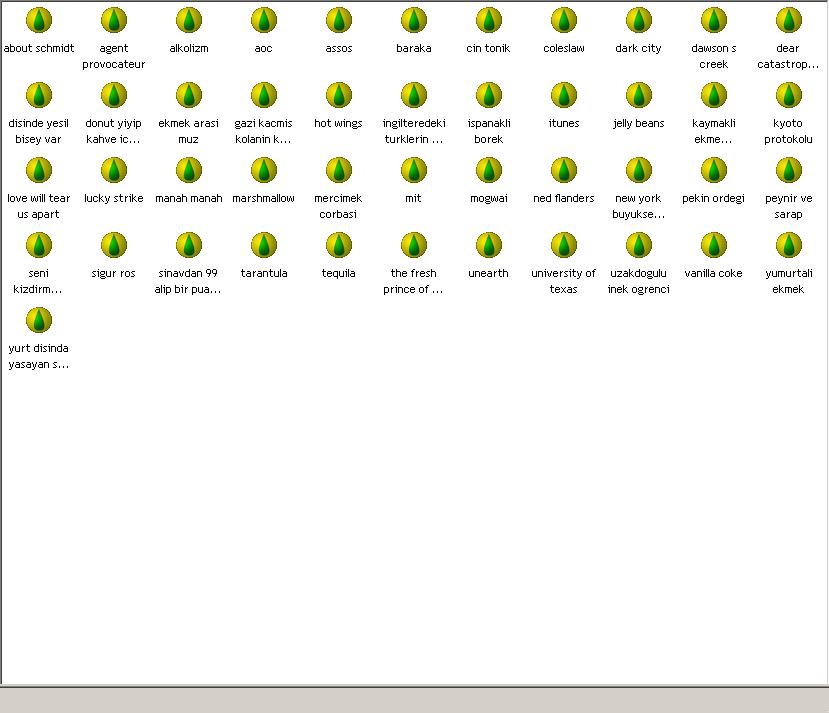
Fig. 13: Common titles list for the users "yasland" and "zeytin"
The items in this tab, “ortak başlıklar”, have the same functionality as any title node in the connectivity graph and have the same context menu. Thus, the details can be inferred from the lines above which mention this context list.
(*): Detailed information about JUNG can be obtained from http://jung.sourceforge.net/.
(**): Website: http://www.yworks.com/
(***): Website: http://graphviz.org/
(****): Website: http://home.so-net.net.tw/oodtsen/wingraphviz/index.htm
(****): Website: http://home.so-net.net.tw/oodtsen/wingraphviz/index.htm
(*****): Detailed information can be obtained from http://www.tev.org.tr/ or http://tevitol.k12.tr/.