Showing posts with label grafik. Show all posts

Saturday, April 25, 2009

ayda bir anca

yoğunum.

öyle böyle değil, her yerden iş yağıyor.  iş yapmaktan iş yapamıyorum; araya giren ıvır zıvır şeyler yüzünden esas uğraşmam gereken ve hepsi de zaman kısıtlarına bağlı işlere eğilmek bir türlü nasip olmuyor, olamıyor.  hani iş konusunda gevşek davranan, yumurta kapıya dayanmadan harekete geçmeyen biri olsam anlayacağım ama böyle bir durum da yok.  işin boktan tarafı, temmuza kadar böyle gidecek gibi.  geçen seneki gibi saçmasapan bir zamanda tatile çıkmak durumunda kalmam umarım.  iyi blog yazısı çıkıyor böyle zamanlarda fakat bünye üzerindeki etkisini sorun siz bir de :)

bitirme projesinde test verisi üzerinde işi epeyce kolayladım.  test verisi derken hafiften istanbul'u andıran (iki bağlantıyla birbirine bağlanmış iki büyük blok) bir bağlantılar grafiği oluşturdum.  110 nokta ve bunları bağlayan 200 küsur doğru parçası duraklarımı ve yol ağını oluşturdu.

[caption id="attachment_181" align="aligncenter" width="419" caption=""test şehri""]"test şehri"[/caption]

durak adları önce y, sonra x koordinat düzlemindeki harf alınarak elde ediliyor, örneğin şehrin kuzeybatı ucundaki durağın adı ka.  bu bağlantılar grafiğindeki yolları izleyerek 110 noktanın tamamını kapsayan 36 hat oluşturdum.

[caption id="attachment_189" align="aligncenter" width="439" caption="hat yayılımı"]hat yayılımı[/caption]

tek tek hatları vermeyeceğim, meslek sırrı :)

işin "epey kolaylanmış" kısmı aktarma hesaplamasını yapan program.  programa başlangıç ve bitiş duraklarıyla beraber maksimum aktarma sayısını girince mantıklı sonuçlar elde edebiliyorum. mesela ab noktasından maksimum 2 aktarmayla jk noktasına nasıl gidildiğini hesaplayalım:


[caption id="attachment_198" align="aligncenter" width="392" caption="hesaplanmış aktarmalar"]hesaplanmış aktarmalar[/caption]

ortaya çıkan seçenek ağacındaki ilk seçeneği şu şekilde dillendirebiliriz: "ab'den 00 numaralı otobüse bin. 1 durak sonra bc'de inip oradan 04 numaralı otobüse bin. 6 durak sonra jk'da in."  arada tek aktarmalı bir seçeneğin (ab'den 04 otobüsüyle 7 durak sonra jk) de bulunduğu, yani maksimum aktarma sayısından daha az aktarmaya sahip durumların da hesaplandığı görülebilir. güzel yani :)  bu yapıya seyahat süresi tahmini ile ilgili yapıyı da eklemlediğimde daha da güzel, tadından yenmeyesi bi'şey çıkacak ortaya.


yarın da dernek yönetim kurulu var ve bu yüzden ferdaanım'ın brunch'ını (so posh, ain't it?) ekiyorum.  zaten sabahın 10'unda kanlıca'da olmamı sağlayacak hızı ve gazı bulmak zor, hele bu sabah bir pazar sabahı ise.  uyuy'cam len?!


Tuesday, May 27, 2008

terms of service

egiBlog'da kullanabileceğim bir widget geliştirmek için bir deneme blog'u açmıştım. sadece başlık, başlıkla aynı entry içeriği ve {a, b, c, d, e} kümesi içinden belli bir bağlantı ağı oluşturacak şekilde tag'leri olan entry'ler girmiştim. tamı tamına 21 tane. sonrasında ne oldu? google şahaneleri bu deneme blogunu askıya alıp dışarıdan erişimi engelledi. niye? süper bayesian filtreleri bu blogu spam blogu olarak sınıflandırmış. eğer 20 gün içinde itiraz etmezsem blog otomatikman silinecekmiş. itiraz sonrası da inceleme yapılacak, ona göre blogun geri gelip gelmeyeceği belli olacakmış. itirazımı yaptım, 5 gün kadar sonra da hiçbir şey olmamış gibi geri geldi test blogum.

anlamadığım konu, dışarıdan herhangi bir sayfaya bir tek link bile yokken (PageRank avcılığı yapmak istemiş olabilirdim) salak sepet bir otomatizasyonla zor durumda kalmış olmak. demek ki neymiş, her denetleme işini algoritmalara devretmek için biraz erkenmiş.

algoritma derken, xkcd'deki karikatür sayfalarının hepsinin altında şu metin var; her okuduğumda gülümsetir:
We did not invent the algorithm. The algorithm consistently finds Jesus. The algorithm killed Jeeves.
The algorithm is banned in China. The algorithm is from Jersey. The algorithm constantly finds Jesus.
This is not the algorithm. This is close.
karikatürlerin hepsi zaten başlı başına yarıcı. az biraz takılın; bilimle ilgileniyorsanız ya da mühendisseniz zaten apayrı bir tat alacaksınız.

Tuesday, April 15, 2008

umudumuz çizgelerde

daha önce de değindiğim gibi çağımız bilgi çağı değil, veri çağı; her tarafımız veriyle dolup taşıyor. verilerin anlam kazanıp bilgiye dönüşebilmesi için işlenmesi, hiç değilse birbirleriyle ilişkilendirilmesi gerekli. ilişkiler bir bağlam ortaya çıkarır ve eldeki verinin daha sağlıklı yorumlanmasını, dolayısıyla kullanışlılığının artmasını sağlar.

verilerin işlenmesi ve ilişkilendirilmesi bu derece önemli. ayrıca görünen o ki verileri bir şekilde ilişkilendirmesini becerenler hayallerinin de ötesinde kazanıyorlar. google mesela. web sayfalarını yalnızca meta tag'lerine göre fihriste almak yerine hepsini yönlü bir çizgenin (directed graph) eklemleri (node) olarak görüp bu eklemlere giren ve çıkan linklerin sayısı ve eklemlerin görece ağırlıklarına göre bir hesap yapması ve sayfaları bu hesabın sonuçlarına uygun şekilde (PageRank diyoruz şimdi kendisine) sıralayıp listelemesi google'ı şu anki konumuna getirdi. facebook'u alalım; her ne kadar ortalığı çerden çöpten uygulamalarla karmakarışık hale getirmiş ve kimi reklam programları (Beacon) ve benzeri girişimleri özel hayatın gizliliği merkezli mide bulantıları yaratsa da temelinde bambaşka bir amaç yatıyor facebook'un. bu amaç üyelerinin, belki bir gün insanlığın sosyal çizgesini (1)(2) çıkarmak.

eninde sonunda bilişim -daha da daraltmak istersek internet- dünyasında en parlak fikirler ya da parlak fikir bekleyen problemler (gezgin satıcı, 4 renk teoremi, vs.) bir şekilde çizgelerle ilgili. bu nedenle çizge teorisi ve uygulamaları üzerinde emek sarfetmeli. hesaplamalı bilimler -ve dolayısıyla bilişim dünyası- için bir umut varsa, o da çizgelerde.

(1) Social Graph: Concepts and Issues, Alex Iskold
(2) Thoughts on the Social Graph, Brad Fitzpatrick

Tuesday, August 7, 2007

bloga dönüş

döndüm, dönebildim, şeyini şeyettiğimin manila'lılarından kalan zamanımın bir kısımcığını buraya ayırabilecek durumdayım. aman da aman, aman da aman!

dönüş derken, seneler önce erich von däniken'in "yıldızlara dönüş"ünü okumuştum. ufocu zamanlarımdı, büyüdüm geçti. neyse, bahsettiğim kitabın inanılmaz komik, şuna benzer bir girişi vardı: "yıldızlara dönüş! 'dönüş' diyorum, bu yıldızlardan geldik anlamına gelmez mi?" mantık bükmenin, ucuz illüzyonun bu kadarı! blogosferden gelen bir blogonot değilim, ama geri dönmek güzel. birikmişleri bırakmanın vakti gelmişti. ne yapmışız bakalım?

madde 1: the simpsons!
the simpsons movie'ye gittim geçen salı. eğlenceli miydi? kesinlikle. yeri geldiğinde çatlayasıya güldüm mü? evet. ama herşeye rağmen bir sinema filmi havasına giremedim; filmin süresinden (kısalığından) olacak herhalde. spider pig mevzuuna hala yarılmaktayım, şarkı da dilime fena halde yapıştı: "spider pig/spider pig/he does whatever a spider pig does"... hele kuyruk jeneriğine eşlik eden a capella versiyonu harika.

madde 2: egiboy outsourcing öğreniyor
işte dış kaynak kullanılan bir projede çalışıyorum. accenture ile çalışıyoruz ve offshore ekibi manila'da. iki aydır fena halde cebelleşiyoruz ve her ne kadar iki ay böylesi bir konu hakkında fikir edinmek için yeterli olmasa da iki satır laf geveleyebilirim diye düşündüm. dediğim gibi, süreç içinde kendimce çıkarımlarım var outsourcing ile ilgili. öncelikle, iş gücü bakımından 1 + 1 (offshore + onshore) kesinlikle 2 etmiyor; 1,5 ile 1,85 arası (yuvarlak sayı verelim de attığımız anlaşılmasın) bir şey ediyor. kırıma neden olan etmenler ise bence (i) offshore ekibinin benzer bir iş deneyimi olup olmadığı, (ii) onshore ekibinin hazırladığı dokümanların kalitesi ve bunların hazırlanma süresi, (iii) iki katmanlı bir faktör olan dil uyumu; geliştirme dili ve değişken adlarını belirlerken kullanılan dil. her ne kadar 1 + 1 outsourcing matematiğinde 2 etmese de masraf konusunda muazzam bir avantaj yarattığı tartışılmaz. unuttuğum bir noktayı da ekleyip bu bahsi kapatayım; iki ekip arasındaki zaman farkı da çok ama çok önemli. mesela, yaz saatini de ekleyince manila ile aramızda 5-6 saat fark oluyor ve bu nedenle -nacizane fikrimce- çok da uyumlu çalışamıyoruz. amerika-hindistan arası 12 saate yakın, ve böylece bir ekibin bıraktığı yerden öbür ekip alıp götürebiliyor işi, ya da onshore ekibin offshore ekibe doküman yetiştirmesi için çok kasması gerekmiyor. yine de türkiye'den herhangi bir firma yurtdışından dış kaynak kullanmalı mı? ben kendimi pek ikna edemedim; amerika-hindistan arasındaki fiyat uçurumu da yok türkiye-filipinler arasında.

madde 3: moleskine!
bir moleskine aldım. evet, tüketim canavarına tasmasını teslim etmiş bir köpeğim artık ben. yalnız, gerçekten daha fazla yazasım, çizesim, karalayasım var adı geçen nesneyi edindiğimden beri.


inanç zamanından kalma bir kareli defterden başkasıyla çalışamama hastalığım olduğundan moleskine'm de kareli. her türlü taslağı, çizimlerimi, yazılarımı ve saçmalamalarımı ilk önce buraya nakşedeceğim ki ilerleyen zamanlarda daha sağlam saçmalayabileyim :P

madde 4: düğün dernek ve epey kırtasiye
geçen hafta inanç'ın mezunlar derneği ile ilgili gelişmeler oldu. açıkçası, yılan hikayelerini solda sıfır bırakacak bir seyir izleyen dernek işlerinde artık -afedersiniz- "aramızdaki cenabet kim?" diye sormaktan başka birşey gelmiyor elimden. tam yüzdük yüzdük kuyruğunda geldik dediğimiz anda hayvan taze deri ceketini geri aldı bizden! olay da şu; okulun şu anki adı türk eğitim vakfı inanç türkeş özel lisesi (kısaca tevitöl - nazal dekonjestan - türk tıbbı'nın hizmetine sunarız) olduğu için ve okulun şu anki yönetimiyle ili ilişkiler içinde bulunmak istediğimizden derneğin adını "inanç liseliler derneği" yerine içinde tevitöl geçen bi'şey olmasını istedik. istemez olaydık! meğer dernek vesairenin adında "türk" ibaresinin geçmesi için bakanlık izni gerekiyormuş. yasaları bilmemek yasalara bağışıklık salamıyor tabii, ama birkaç kez ve birden fazla avukata inceletilmiş bir metindeki böylesi bir ayrıntının işin uzmanları tarafından atlanmış olması... ne bileyim, içime sinmiyor. hani bülent ecevit'in de içine sinmezdi ya hiçbir şey, aynen öyle. ağustos sonuna kadar bakacağız bi'şeyler, tam detayları ben de bilemiyorum ne yazık ki. umalım ki 30 ağustos'a yetişsin; sezai bey'in huzuruna derneksiz çıkmak da pek içime sinmeyecek zira...

madde 5: girişimciler kulübü girişimi
"yeni ekonomi" hedesi ortaya çıkalıberi herkes bir sonraki parlak fikri bulup, satıp/ürüne çevirip voliyi vurma peşinde. inanç forum'da önce iddialı bir şekilde "gelin şirket kuralım" diye caner'in ortay attığı bir fikrin yine forumda şekillenmiş ve görece daha mütevazı hali diyelim girişimciler kulübü'ne. daha ilk toplantımızı bile yapmış değiliz, çok iddialı da değiliz (daha doğrusu, girişim sermayesi kavramının türkiye'deki görece yokluğu nedeniyle otomatikman kabuğumuza doğru itiliyoruz mütemadiyen). hiçbir şey yapmasak masa başında memleketi kurtarırız, ne gam? tüm inançlı'ları, inanç insanlarını bekliyoruz...

madde 6: yorumsuz blog olmaz, hadi duvaksız gelin bi' derece
özellikle altivi konusunda bloglayıp bir ekşi entry'si ile ufaktan reklam yapınca egiBlog'un ziyaretçisi epey arttı diyebilirim. yine de anlayamadığım bir durum mevcut; gelenler geldiklerini nedense pek belli etmek istemiyorlar sanki. uzun zamandır hiçbir blog girişime yorum yazılmamış. geliyorsanız ses verin, gelecek sefere pencerenin önüne elmalı turtanızı bırakayım. iyi deyin, kötü deyin, ama bir şekilde ses verin.

madde son: bekleyen işler
çok. gerçekten çok. altivi incelemeleri kapsamında bir teklif sayısı takip programı yazmam gerek. belli aralıklarla ilgilenilen ihaleleri ziyaret edip verilen tekliflerin sayısını takip eden ufak bir program olacak bu; atla deve değil yani. bunun üreteceği veri ile eldeki verileri karşılaştırıp altivi kullanıcılarının teklif verme örüntülerini ve en az teklifler ihale kapatmak için bir yöntem olup olmadığını araştıracağım. sonraki işleri de byblos (kütüphane şeysi), ek$iVista online (the ultimate vaporware) ve "muha!" kişisel muhasebe uygulaması sırasıyla önceliklendirdim.

unutmadan, bir detayı daha var altivi uygulamasının. 3 boyutlu bir basit bir grafik çizmekle uğraşıyorum. 3 eksenim olacak: kullanıcı, fiyat ve ihale bitimine kalan süre. her kullanıcı-fiyat-zaman üçlüsünü bir küp olarak göstereceğiz. eksenlere tıklandığında gerçek değerler/frekans toggle'ı yapılacak. kodu c# ile yazıyorum. yol göstermek, kaynak önermek isteyen? 3d çizimi nasıl optimize ederim mesela, görünmeyen kısımları çizmemek yardımcı olabilir, ama bunları nasıl belirlerim? "yol yakınken" falanla bana gelmeyin, çok pis dalarım :P sonuçta bir programcının en sadık dostu ne bilgi ne deneyim ne de acı kahvedir, halis budaklı meşe odunudur.

cidden, yardımlarınız değerinde alınır.

Saturday, April 7, 2007

ek$iVista grafik şeysi...

grafiği çizdirmek için wikipedia'da bir gıdım pseudocode buldum, yalnız benim çizdirmek istediğim grafik için ne kadar ölçeklenebilir bilemiyorum. olayımız ise şöyle; grafiğimiz tipik bir yönlü çizge (directed graph) ve çizgemiz köşe ve kenarlardan (vertices and edges) oluşmakta. force-directed yaklaşımda köşelerimizi eş yüklü parçacıklar, kenarlarımızı da birim uzunlukta türdeş (öss günlerim geldi aklıma birden-türdeş!) yaylar olarak kabul ediyoruz ve oluşturduğumuz çizgenin köşelerini rastgele düzleme dağıtıp sistemin hooke ve coulomb kanunlarına göre dengelenmesini bekliyoruz. ortaya gayet estetik, takip etmesi kolay çizgeler çıkıyor, yalnız yukarıda bahsetiğim ölçeklenme problemi had safhada; kulanılan algoritmanın hesaplamasal karmaşıklığı (böyle mi çevirmeliyiz computational complexity'yi?) n^3 seviyesinde! oha ki ne oha!

ya balık gözü benzeri, yalnızca odaktaki başlığın 2 link ilerisini göstereceğim, ya da başkaca yöntemler bulacağız; artık genetic mi kasarız, apayrı birşey mi kastırırız bilmem.

of ya, of!

Sunday, September 10, 2006

ararsan bulursun...

çoooook uzun zamandır web üzerinde çalışabilecek, "graph layout" ("çizge dizgesi" mi desek :P ) da yapabilecek bir uygulama/algoritma arıyordum. AYLARDIR.

sonunda buldum! hem de javascript ile yapmış adam. helal olsun valla; en kralından bir spring layout...

bu da linki.

Friday, June 23, 2006

comp 491: report | ek$iVista

ek$iVista

The Problem: Designing a program that generates a digraph from the edge data generated by ek$iEdgeDump.

Design: This part of the project was the most troublesome part, involving a cascade of decisions. As the project supervisor, Prof. Attila Gürsoy advised making use of graph layout libraries, such as JUNG(*) (Java Universal Network/Graph Framework), yWorks(**) or GraphViz(***). During the research phase, however, it was observed that neither of these options was worth the effort; JUNG could not be used within C#, yWorks was a commercial package with costs beyond my budget for the foreseeable future, GraphViz seemed too hard to implement. Later on, I found a Windows DLL port of GraphViz(****) and modified ek$iVista to generate a text file in DOT format (file format accepted by GraphViz). However, the lexer inside GraphViz could not parse the text file generated by ek$iVista with no apparent reason, so the use of the GraphViz was out of question. It was becoming obvious that the layout algorithm and generation of the diagram had to be handmade.

From a very large array of layout algorithms, like the Kamada Kawai algorithm, a random vertex-placement algorithm and many tree layout algorithms, the circle layout was chosen, because in this layout, the vertices were pushed near the borders of the diagram and the center part was left vacant for the edges to be placed. Also, the coordinates of vertices and edges could be calculated by simple trigonometry. First of all, a minimum distance between two vertices is defined; let us name it md. If there are v vertices laid out evenly on the perimeter of a circle, the perimeter is expected to be roughly (md x v) units. The radius of the circle, hence, is (md x v)/2π. The position of the nth vertex on the diagram, given the center of the diagram as the Cartesian pair (cx, cy) is the Cartesian pair (cx + cos(360n/v)((md x v)/2π), cy + sin(360n/v)((md x v)/2π)). As we know the coordinates of the vertices and have a list of edges, drawing the directed edges should be trivial.

Everything is expected to fit in without any problems, but expectations are not always met. For enabling interactive vertices that respond to clicks, a control named VistaVertex was created which contained four buttons envisaged to fire some events and methods. However, as the number of vertices rose, the application became more than cumbersome. Also, an unadvertised “feature” of Windows surfaced; one cannot create more than 10,000 controls per application, because Windows cannot generate “handles” for them. Because of this limitation, the use of controls was impossible; the diagram had to be painted on the form and it could not be interactive for the time being. During this phase, I had mounting difficulties when the form had to be refreshed, because whole diagram had to be painted from scratch and I could not figure out a method to avoid this. Finally, I decided to generate a viewable image by using the graphics libraries provided in C#, and discovered another hidden limitation; drawing images larger than 32,678 x 32,768 was impossible. Such a limitation was also imposed upon the size of forms; although the property that keeps the height and width of the form is of type Int32 (232 ≈ 4 x 10⁹), the maximum value it accepted was 215. With the current number of vertices, however, this poses no big problem.

The program first reads the source titles into a Hashtable and gets the total number of vertices. After this, a SortedList (a Hashtable sorted according to the keys of the items) object is populated by Point objects that store the calculated coordinates of the vertices with the title names assigned as their keys. Then, EksiEdgeData table is read from beginning to end; if the source title corresponds to a key in the hashtable, the directed edge is drawn. After all the edges are drawn, the vertices are drawn onto the image, and finally, the image is saved at a fixed location, the root of the C:\ drive.

-assume that here placed is a friggin' large image which resembles the lunar surface or a colour-inverted solar eclipse-

The graph drawn by ek$iVista, although substantially rich in data, is not very adept at displaying the connections between Ekşi Sözlük titles as much of the meaning is lost in the clutter. As it was stated before, the “final” graph produced contained the details of only a small portion of Ekşi Sözlük data and finally, the graph, although envisaged to be interactive at first, was far from interactivity. To rectify these shortcomings, a new version for ek$iVista was
written. A new problem statement would do this new application justice, and it is given below:

The Problem: Providing means of visualizing and analyzing Ekşi Sözlük data gathered by ek$iDump – especially the links between titles and the users contributing to titles. Also, correcting the flaws of the first version; trying to draw the whole graph which makes it unintelligible, having to rely on a separate table (EksiEdgeData) generated beforehand to come up with the graph while the data for it could be generated on-the-fly, and providing no outlets for interactivity.

Design and Implementation: The first design decisions were about what to include in this application and what to leave out. To see what has been done clearly, let us use a weekly update mail as our checklist:


“I spotted a graph visualization package named Netron (http://netron.sourceforge.net/) and will be using this package for the title connections graph.”

The graph visualization package that has been used, as it is stated above, is an open-source package named Netron, an initiative started by François Vanderseypen to provide a functional library of tools written in C# for producing diagrams in .NET platform. Netron contains many object types necessary to draw a connectivity graph and also some layout algorithms, such as the tree layout, random layout and the spring embedder. As the library is open source, it is freely extensible. Another interesting feature of this library is its support for drawing cellular automata outputs. The title connectivity graph generated by ek$iVista makes use of this library and the layout algorithm chosen is the spring embedder algorithm.

  • “The queries that I am going to use in ek$iVista are:
    • The one that will be used to draw the connectivity graph (with the option of displaying titles 1, 2, 3, 4 and 5 clicks ahead)
    • Simple queries that will list the users who contributed to the title and the entries under the title (with the option of opening it from the database with or directly from Ekşi Sözlük)
    • Queries that will help to draw timelines for activity, for titles and users
    • A query for finding the "intersection set" of the titles written to by two distinct users”

All the queries mentioned above are included with one addition and one exception; the option of opening the entries under a title from the database was omitted as Ekşi Sözlük contained the most up-to-date information on any title imaginable, and as listing more than 700,000 titles in a combo box used to select the title to work on is a fairly daunting task, a query for listing the 10 titles most relevant to the given input was added. These queries were implemented as stored procedures as the data traffic is minimized between the application and the RDBMS and time is used more efficiently as stored procedures precompiled and prepared; they do not have to be compiled over and over like other SQL statements. The number of stored procedures used is five, and they are:

top10matching: Returns the first 10 matches to the title value input.

CREATE PROCEDURE top10matching @whattitle nvarchar(50) AS SELECT TOP 10 title FROM Titles WHERE title LIKE @whattitle

entryProc: Returns the full list of entries entered under a title.
CREATE PROCEDURE entryProc @whattitle nvarchar(50) AS SELECT * FROM Entries WHERE title = @whattitle
suserIntitle: Returns the full list of susers (without repetition) under a title.

PROCEDURE suserInTitle @whattitle nvarchar(50) AS SELECT dbo.Susers.suser, dbo.Susers.suserID FROM dbo.Susers INNER JOIN dbo.Entries ON dbo.Susers.suserID = dbo.Entries.suserID WHERE (dbo.Entries.title = @whattitle) GROUP BY dbo.Susers.suser, dbo.Susers.suserID

entriesOfSuser: Returns the full list of entries contributed by a suser.

ALTER PROCEDURE entriesOfSuser @whatsuser int AS SELECT * FROM Entries WHERE suserID = @whatsuser
togetherProc: Returns the titles (without repetition) written to by both of the two given susers.

PROCEDURE togetherProc @id1 int, @id2 int AS SELECT title FROM dbo.Entries WHERE (suserID = @id1) GROUP BY title HAVING (title IN (SELECT title FROM dbo.Entries WHERE suserID = @id2))


Although the queries used are fairly simple (the last one is a simple nested query) any timewise gain obtainable had to be obtained, because the system the database runs on (an AMD Athlon 2000+ with 512 MB main memory) is not very powerful as to meet Microsoft SQL Server’s needs.

Other design decisions will be explained in detail in the Walkthrough section, where a normal run of ek$iVista is exhibited.

Walkthrough:
A splash screen like this welcomes the users of ek$iVista.


Fig. 6: Splash screen of ek$iVista


If not desired, it can be eliminated by passing /nosplash argument before running the application. The splash screen was seen as necessary because the user has to be sure that the program is functioning normally as the application strives to scan all (exact number is 781, 367) of the titles in the database and add them to a Hashtable which will be used to check whether the destination titles exist or not. After the scanning of titles is complete, the main form of the application is displayed:
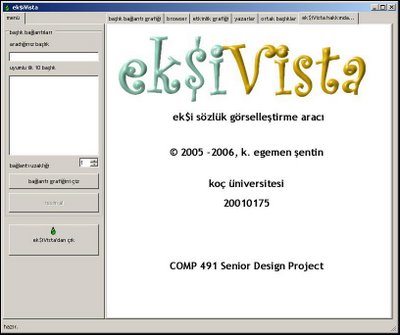


Fig. 7: ek$iVista - overview


As one can see, the interface is fairly simple with TabView components used as sub-forms. An MDI (Multiple Document Interface) form could have been used instead, but MDI forms are not very easy for the end user to deal with and can get scattered around, providing a messy outlook. The tabs contain controls that help display the outcomes produced by the program; “başlık bağlantı grafiği” (title connectivity graph) displays the connectivity graph of a title by making use of the Netron graph control, “browser” displays the contents of titles in Ekşi Sözlük with the help of an Internet Explorer control, “etkinlik grafiği” (activity graph) displays the activity recorded under a title or of a suser in the form of a 3D bar chart with the aid of a Microsoft Chart control, and “yazarlar” (writers) and “ortak başlıklar” (common titles) display the writers (susers) under a title and the common titles of two susers, respectively. These two tabs make use of the ListView control.

At the main entry point, we begin by entering some text in the text box under the label “aradığınız başlık” (the title you are looking for). As one types further, the list below the text box is updated by using the top10matching query to list the 10 titles that are the most relevant to the text entered. This feature helps users to narrow down their searches and find titles when they are not sure of the title they want to inspect. An example is given below.


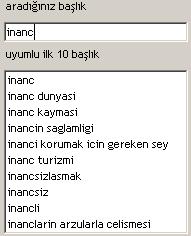
Fig. 8: Title search feature


We advance by selecting a title from the list, select a value for the hop distance (between 1 and 5, inclusive) from the number selector and click “bağlantı grafiğini çiz” (draw connectivity diagram) to see the connectivity graph with the selected title as the center and the titles at the clicking distance selected from the number selector. If one clicks the button without selecting a title from the list, an error message is displayed.


Fig. 9: Error message - "A title should be chosen from the list."


This connectivity graph is drawn by a BFS (breadth-first search) – like algorithm which takes a starting node (title) and scans through the entries under a title, adding the links inside the entries to a list and drawing the connections between them. If the final hop value is not reached, the titles inside the list formed are scanned and the method for drawing the graph is called for every value in the list.

The graph drawn when the selected title is “inanç lisesi” (the high school that I was graduated from – now known as TEV İnanç Türkeş Özel Lisesi(*****)) and the hop distance as 1 is shown below, with the context menu shown when a title is clicked.


Fig. 10: Title connectivity graph with its context menu

The context menu options are:
  • “benzer başlık bul” (find similar titles) posts the title name to the text box labeled “aradığınız başlık”,
  • “yazarları göster” (show writers) displays the list of susers who contributed to the title in the “yazarlar” tab,
  • “etkinlik grafiği” (activity graph) shows the activity graph of the title in the “etkinlik grafiği” tab,
  • “ek$i’de aç” (open in ek$i), as its name suggests, opens the title in Ekşi Sözlük, displayed in the “browser” tab.

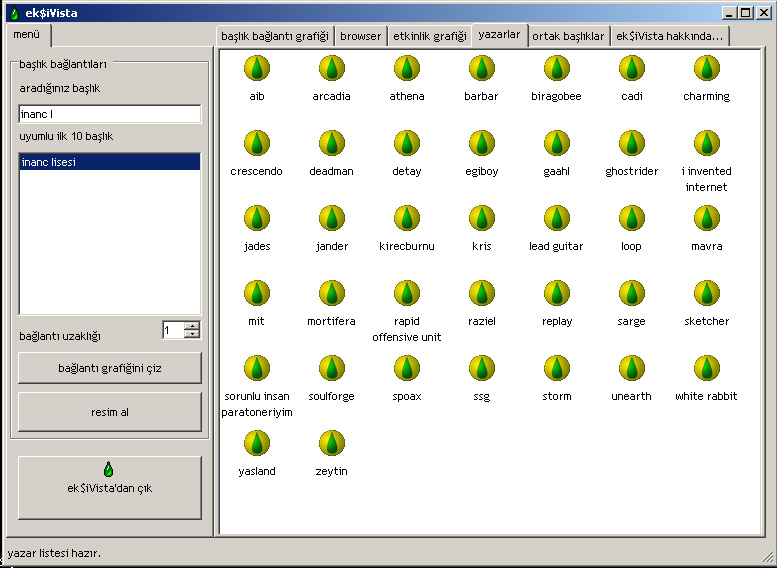
Let us see who has written under the title “mit” by clicking the appropriate menu item. The result, produced by the susersInTitle query, is shown in Fig. 11:


Fig. 11: The list of users who have written under the title "mit"

The activity graph of the title “mit” is obtained by clicking “etkinlik grafiği” in the context menu, which is a bar chart displaying the monthly entry counts of a title or a suser. Three types of activity graphs exist; a general view which displays months, years and number of entries on the axes, the month-based view which shows the counts of entries entered in the 12 months of the year and the year-based view which shows the entry counts corresponding to the years starting from 1999, the year Ekşi Sözlük was established. All three graphs are shown below, in Figs. 12:


Figs. 12: General, monthly and yearly activity graphs for the title "mit"

Activity graphs are obtained by calling queries that return entry data. In this entry data, the date the entry was entered is stored as a string value, since, in Ekşi Sözlük, both the date of entry and – if the title is edited later on – the date of the latest edit is stored. As it was not desirable by the designer to work on tables that contain null values (the edit date for entries that are not edited), this scheme of storing date values was adopted; strings can be programmatically parsed down to integer values.

A two-dimensional integer array for storing entry frequencies is created and for every entry data acquired, the date string is obtained, the month and year value is picked and the frequency value corresponding to the month and year value is incremented by one. After all the entry values are consumed, the array is fed to the graph control as data, and thus the activity graph is drawn.

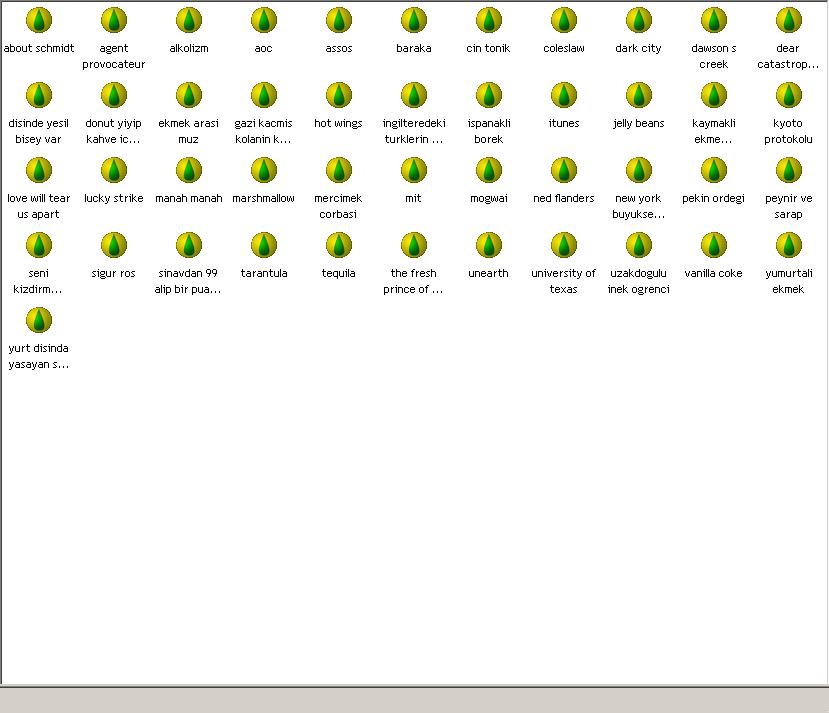
Going back to Fig. 11, we can experience more of the functionality of ek$iVista. When we right-click any portion of the susers list, a context menu appears as shown in Fig. 13. This context menu provides two choices for the user; “ortak başlıkları listele” (list common titles), when two suser names are selected, lists their common titles in “ortak başlıklar” (common titles) tab, and “etkinlik grafiği” (activity graph) which displays the activity graph pertaining to the selected suser. If the selection criteria (selecting 2 susers for “ortak başlıkları listele” or selecting 1 suser for “etkinlik grafiği”) are not met, error messages are displayed. Let us see what happens when we choose two arbitrary susers from the list and request to see their common titles. The common titles list for the susers “yasland” and “zeytin” are shown in the figure below:
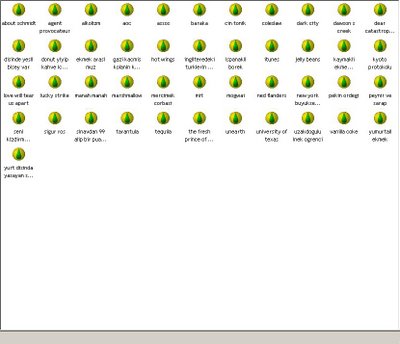


Fig. 13: Common titles list for the users "yasland" and "zeytin"


The items in this tab, “ortak başlıklar”, have the same functionality as any title node in the connectivity graph and have the same context menu. Thus, the details can be inferred from the lines above which mention this context list.


(*): Detailed information about JUNG can be obtained from http://jung.sourceforge.net/.
(**): Website: http://www.yworks.com/
(***): Website: http://graphviz.org/
(****): Website: http://home.so-net.net.tw/oodtsen/wingraphviz/index.htm
(*****): Detailed information can be obtained from http://www.tev.org.tr/ or http://tevitol.k12.tr/.

Thursday, June 22, 2006

comp 491: preliminary report

hani proce raporu diyorduk ya, işte ta kendisi. ancaaaaak, önce neyin üzerine rapor yazıyoruz bilelim, di'mi?

i kept on telling about some project report, and there it is. but first of all, we have to know what this report is written about, innit?


12.11.2005

Topic:
Ekşi Sözlük Graph Visualization Tool

Motivation: Ekşi Sözlük (http://sozluk.sourtimes.org/) is a popular Turkish web site, up and running since February 15th, 1999. Having about 10,000 active contributors (susers – Sözlük users in Ekşi Sözlük jargon), this web site is basically a hypertext dictionary comprising of the entries of its collaborators. In Ekşi Sözlük, one can find explanations and definitions of almost any concept one can think of. In Ekşi Sözlük’s jargon, a concept for which information can be found is called a “title” (literal translation of “başlık” from Turkish). Each individual definition, explanation, or information of any kind is called an “entry”. There may be any number of entries posted under a title. What makes Sözlük different from any other plain text based dictionary is that it contains hyper-textual references to other titles. The data to be used in this project is obtained by crawling through the entries of Ekşi Sözlük.

Scope: A detailed inspection of Ekşi Sözlük data in the form of a digraph as a way of representation, with some simple algorithms employed for coming up with the digraph. Extensions, such as marking the titles one specific suser has written, finding cycles of association or creating timelines (or a histogram) of activity for a specific title can also be implemented.

Method: As an initial step, a crawler for extracting Ekşi Sözlük data, named ek$iDump was written in C#, which is a simple, single-threaded application which accesses Sözlük entries one by one by their numerical ID and dumps the necessary details to a non-relational Microsoft Access database. Currently all entries until the ID #3300000 have been crawled. Due to the high number of deleted entries by moderation, the choice of the suser or voiding of the suser account, the total number of entries stored locally stand close to 2,000,000. As of December 12th, 2005, there are more than 5,000,000 entries posted under about 1,100,000 titles and the ID of the most recent entry is #8685844. This may give a measure of the density of Sözlük data (detailed statistics can be found at http://sozluk.sourtimes.org/stats.asp). Due to time limitations, a cutoff point will be selected (ID #4000000 or #5000000 is considered). The latter and final step is to design and implement the graphing tool which will work on the extracted data. This tool will make use of some simple algorithms or checks. Some are:
  • Checking the number of entries under a destination title before assigning a connection between two nodes depicting titles. This will be necessary, as links sometimes are used for other purposes by susers, such as emphasizing a part of the entry. Also, some links point to non-existent titles which should be eliminated.
  • Possibly, a node distribution algorithm, so that no node of the graph overlaps with another to allow clarity of presentation.
Expected Results: A report of the senior design project with extended demonstrations of the final product, the graphing tool which is expected to generate a “forest” of Ekşi Sözlük data. As mentioned above, the data extraction tool (crawler) is complete with a collection of classes to be able to acquire and arrange Ekşi Sözlük data, namely the Ek$iAPI; although can still be improved speedwise. The graphing tool is currently in the drawing-board phase.